Convenience Store Energy Monitoring: The Hidden 19% Savings in 2026

Convenience stores consume 52.5 kilowatt-hours per square foot annually, over four times the 12.6 kWh average for all commercial buildings tracked by the U.S. Energy Information Administration. With refrigeration alone accounting for 47-66% of total electricity consumption and most stores operating around the clock, energy is typically the second or third largest operating expense after labor and rent. For an industry running on 1-3% profit margins, that energy spend represents one of the few controllable costs with meaningful savings potential.
If your monthly utility bill arrives and all you can do is pay it, you’re operating blind. You don’t know which systems are driving costs, when consumption spikes occur, or whether your equipment is running efficiently. The Minnesota Department of Commerce studied 50 convenience stores and found average savings potential of 19% – approximately $5,000 to $6,000 per store annually – hiding in refrigeration inefficiencies, HVAC conflicts, and lighting waste that no one could see without data.
Store energy monitoring changes that equation. By tracking consumption at the system and equipment level in real time, monitoring reveals exactly where your energy dollars go and which dollars you can reclaim. The 152,000+ convenience stores in America collectively spend billions on electricity each year. The ones gaining a competitive edge are the ones that measure, monitor, and act on their energy data.
Store energy monitoring reveals hidden waste that monthly utility bills never show. Here’s what the data says about retail energy consumption:
These numbers come from EIA commercial building energy surveys and state-level efficiency studies. What they reveal is an industry-wide opportunity that most operators are missing. Energy monitoring through Monitoring as a Service (MaaS) makes capturing these savings accessible to stores of any size – without massive capital investment or technical expertise. Here’s where your energy dollars actually go and how continuous store energy monitoring changes the equation.
Why Convenience Stores Are Energy Hogs
The U.S. Energy Information Administration classifies food sales buildings – which includes convenience stores – as one of the most energy-intensive building types in commercial real estate. According to EIA CBECS data, the electricity intensity for these buildings runs 53.3 kilowatt-hours per square foot, compared to 12.6 kWh per square foot for all commercial buildings. Three systems drive the majority of that consumption, and all three run around the clock regardless of customer traffic.
Refrigeration: 47-66% of Total Electricity
Walk-in coolers, reach-in refrigerators, frozen food cases, and beverage coolers. EIA data shows refrigeration accounts for the largest share of end-use consumption in food sales buildings at 38%, with energy intensity of 87.1 MBtu per square foot. Industry analyses put the figure even higher for convenience stores specifically, ranging from 47% to 66% of total electricity consumption depending on store format and climate zone.
A typical convenience store’s refrigeration equipment costs approximately $996 per month to operate. That’s nearly $12,000 annually just to keep products cold. Refrigeration systems don’t signal when they’re working harder than necessary. A dirty condenser coil, a failing door gasket, or a compressor cycling too frequently all drive costs up without any visible warning. Store energy monitoring catches these efficiency losses as they develop, before they become expensive failures.
HVAC: 22% of Total Energy
Heating, ventilation, and cooling account for roughly 22% of store energy consumption according to EIA breakdowns. Space heating takes 14%, ventilation 3%, and cooling 5%. These percentages shift dramatically based on climate, building age, and operating hours. A 24-hour store in Phoenix has very different HVAC demands than a 16-hour store in Minnesota. Without monitoring data to reveal the actual consumption patterns, most operators rely on thermostat settings and hope for the best.
The challenge with HVAC is that it often fights against refrigeration. Your air conditioning works to cool the store while open refrigerated cases dump cold air into the space. Your heating system works to warm the store while freezer cases radiate cold. Without store energy monitoring to reveal these conflicts, you’re paying to heat and cool the same air multiple times. This is why indoor air quality and environmental monitoring increasingly integrates with energy tracking – the systems are interconnected.
Lighting: 8-20% of Total Electricity
Interior lighting, exterior lighting, signage, and refrigerated case lighting combine for 8-20% of total consumption depending on fixture types and operating hours. Stores still running T12 fluorescent lamps or older T8 systems are burning significantly more electricity than necessary. LED conversions can cut lighting energy by 50% or more while improving light quality, and the federal 179D tax deduction can offset a significant portion of upgrade costs.
The hidden cost in lighting isn’t just the electricity to power the fixtures. It’s the heat those fixtures generate that your HVAC system then has to remove. Old fluorescent fixtures in refrigerated cases force the refrigeration system to work harder, compounding waste across multiple systems. Store energy monitoring quantifies these interactions so you can prioritize the upgrades that deliver the largest combined savings.
Convenience Store Energy Consumption by System
- Refrigeration: 47-66% of electricity (walk-ins, reach-ins, display cases) – EIA CBECS data
- HVAC: 22% of total energy (heating 14%, cooling 5%, ventilation 3%)
- Lighting: 8-20% of electricity (interior, exterior, signage, case lighting)
- Cooking/Food Prep: 5-11% (ovens, warmers, coffee equipment)
- Other: 2-7% (computing, POS systems, miscellaneous plug loads)
The Real Cost of Operating Without Visibility
Most store operators know their total electricity bill. They can tell you it’s $1,800 this month or $22,000 this year. What they can’t tell you is which systems are driving that cost, when peak consumption occurs, or whether equipment is running efficiently. That lack of visibility is expensive, and it compounds every month you operate without data.
The $6,000 Hiding in Your Utility Bills
The Minnesota Department of Commerce study of 50 convenience stores found average electricity use of 364,000 kWh annually. More importantly, it identified average savings potential of 19%, corresponding to approximately $5,000 to $6,000 per store per year. Similar analyses suggest savings of $6,090 to $7,420 annually through targeted efficiency measures including LED lighting upgrades, refrigeration controls, HVAC optimization, and maintenance improvements.
The critical insight is that you can’t capture these savings if you don’t know where the waste is occurring. Store energy monitoring provides the visibility that makes optimization possible. It turns a lump-sum electricity bill into an actionable breakdown showing exactly which systems, circuits, and equipment are consuming more than they should.
The Spoilage Connection
Energy waste and product spoilage are directly connected. According to NACS (National Association of Convenience Stores), average spoilage runs $8,604 to $10,188 per store per year depending on company size. Refrigeration failures are a primary driver of that loss. When a compressor starts failing, it often consumes more energy before it stops working entirely. Without monitoring, you’re paying elevated electricity costs while your equipment degrades toward failure. Then when it fails, you lose inventory.
Store energy monitoring integrated with temperature monitoring catches the efficiency decline early, allowing intervention before both the energy bill and the inventory suffer. A walk-in cooler compressor that normally draws 4.2 kW but starts averaging 4.8 kW signals a problem developing – one that monitoring catches weeks before a complete failure and spoilage event. This is the same predictive approach that reduces equipment maintenance costs by 25-40% across commercial facilities.
The Margin Math That Changes Everything
Convenience stores operate on margins of 1-3%. That means for every dollar you save on energy, you’d need to generate $18 to $100 in additional sales to achieve the same profit impact. According to EPA ENERGY STAR, every $1 a food retailer saves in energy costs equates to increasing sales by $18 at the low end of the margin range. Using that formula, $6,000 in annual energy savings equals the profit impact of $108,000 in additional sales.
Which is easier to achieve: cutting energy waste through monitoring, or driving an extra $108,000 through your registers? For most stores, the answer is obvious. This is why reducing energy costs delivers outsized returns relative to the investment – especially when store energy monitoring through MaaS eliminates the upfront capital barrier entirely.

Continuous store energy monitoring reveals exactly where your electricity dollars go, turning guesswork into data-driven optimization across refrigeration, HVAC, and lighting.
Five Hidden Energy Drains Store Energy Monitoring Exposes
Store energy monitoring reveals specific waste patterns that manual observation and monthly bills miss entirely. Here are the five most common energy drains that continuous monitoring exposes in retail environments.
1. Refrigeration Running Beyond Capacity
Refrigeration systems are designed for worst-case ambient temperatures. They’re sized to handle the hottest day of the year with doors constantly opening. But on a mild Tuesday night with no customers, that same system runs at the same intensity. Floating head pressure controls can reduce refrigeration energy by up to 20% by adjusting compressor operation to actual conditions. Monitoring reveals when compressors cycle more frequently than normal, when temperatures run colder than necessary, and when defrost cycles consume excessive energy. These patterns are invisible without continuous data collection.
2. HVAC and Refrigeration at War
Open refrigerated cases dump cold air into the store. The HVAC system responds by heating. Then the refrigeration works harder because ambient temperature dropped. This conflict wastes energy on both sides. Store energy monitoring identifies these patterns by correlating HVAC runtime with refrigeration load, revealing when the systems work against each other. One major chain implemented a 2-degree thermostat adjustment across stores and estimated savings of roughly $800 per store from a simple setpoint change. But you can only make intelligent adjustments when you have data showing how your systems interact. The same building energy management principles apply whether you operate one location or hundreds.
3. Lighting That Serves No One
Stores operating 24 hours often run full lighting around the clock even when customer traffic drops to near zero overnight. Dual-level switching allows fixtures to be turned off during low-traffic hours without compromising safety. Exterior lighting is another opportunity – parking lot lights running at 100% at 3 AM serve no purpose beyond security. Occupancy-based dimming or scheduled reduction can cut overnight exterior lighting costs by 30-40% without compromising safety. Store energy monitoring tracks these patterns and quantifies the savings opportunity.
4. Phantom Loads Adding Up
Coffee brewers, display warmers, register monitors, signage, cooler lights. Equipment that’s “off” often isn’t really off. Phantom loads – the energy devices consume in standby mode – add up across dozens of devices. Smart power strips with occupancy sensors can eliminate this waste by cutting power to devices when not needed. Without monitoring at the circuit level, phantom loads remain invisible and ongoing.
5. Maintenance Deferred Until Failure
Dirty condenser coils force compressors to work harder. Clogged air filters restrict HVAC airflow. Worn door gaskets let cold air escape. Each of these maintenance issues increases energy consumption before causing equipment failure. Store energy monitoring catches the efficiency decline, flagging equipment that’s consuming more energy than baseline. This enables condition-based maintenance rather than run-to-failure approaches – the same strategy that manufacturing facilities use to prevent costly unplanned downtime.
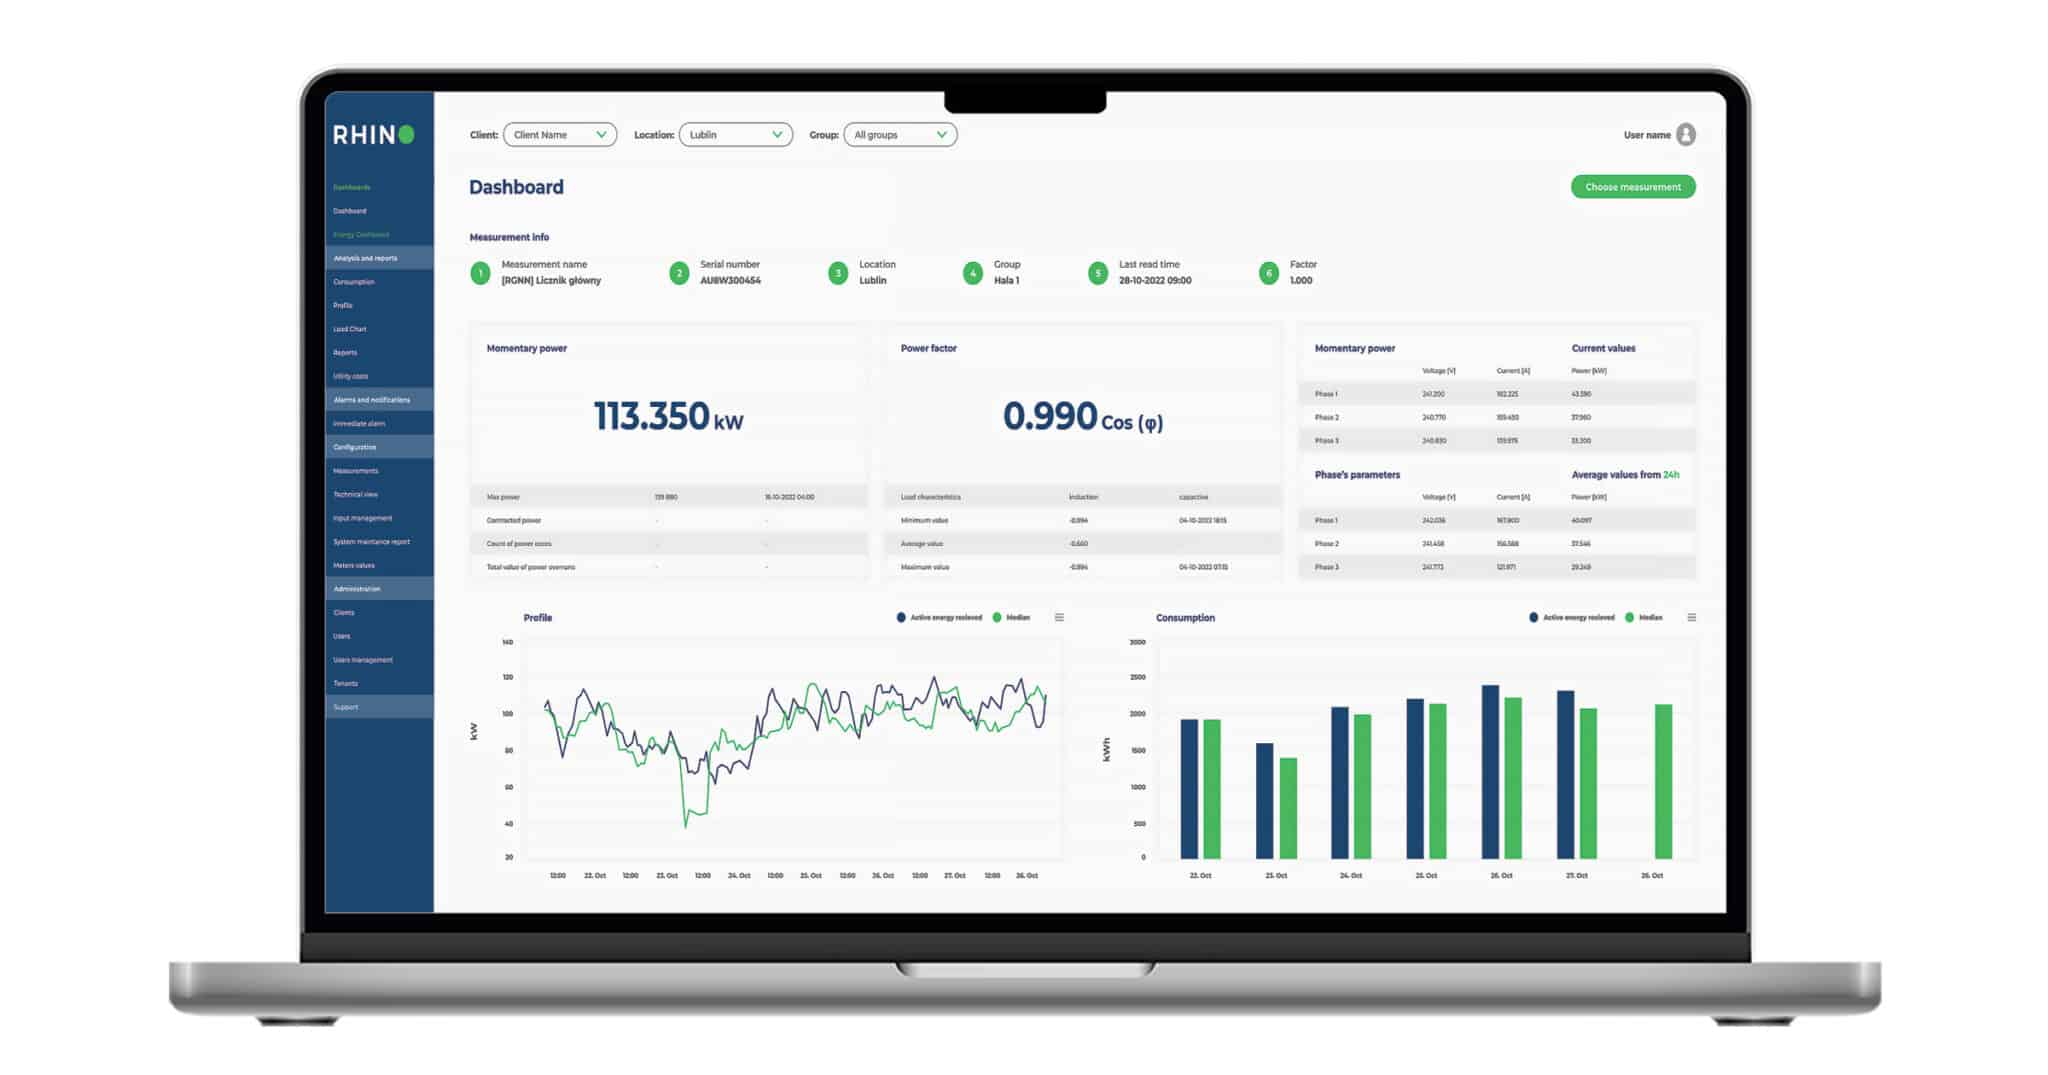
Real-time store energy monitoring dashboards provide system-level consumption breakdowns and trend analysis that enable targeted energy optimization across all store locations.
What Store Energy Monitoring Actually Shows You
Continuous monitoring transforms energy management from guesswork to precision. Here’s what visibility actually looks like in practice for store operators.
Instead of waiting for a monthly utility bill to discover you used more electricity than expected, store energy monitoring shows consumption in real time. You can see exactly when peak usage occurs, identify anomalies as they happen, and correlate energy use with operational events. System-level monitoring reveals that refrigeration consumed 58% of your cost, HVAC took 24%, and lighting used 12%. That breakdown is actionable. A walk-in cooler drawing 4.8 kW instead of its normal 4.2 kW signals a problem developing before it becomes a crisis.
For multi-location operators, monitoring enables benchmarking across stores. Why does Store #7 use 23% more energy per square foot than Store #12? The data reveals the answer – whether it’s older equipment, different operating hours, climate differences, or operational practices. According to EPA ENERGY STAR data, buildings that benchmark their energy use on a regular basis reduce their energy consumption by 2.4 percent per year on average. For retail operations spending $20,000+ annually on electricity, that adds up fast.
How Much Energy Waste Is Hiding in Your Store?
Discover how continuous monitoring can reveal the 19% average savings potential hiding in your store’s refrigeration, HVAC, and lighting systems. Our experts will assess your current energy profile and show you exactly what’s at risk.
Store Energy Monitoring for Different Retail Types
While convenience stores represent the most energy-intensive retail category, store energy monitoring delivers value across the retail spectrum. Each store type has unique consumption patterns and optimization opportunities that monitoring reveals.
Convenience stores and gas stations offer the highest savings potential with refrigeration dominating at 47-66% and 24-hour operations common. The Minnesota study found chain stores with car washes had the highest energy use, while independent stores had the lowest. Grocery and specialty food retail operations face similar challenges at greater scale – a mid-size grocery store can spend $160,000 annually on electricity, and monitoring at that scale reveals inefficiencies translating to tens of thousands in savings.
General retail and commercial real estate stores without significant refrigeration focus monitoring on HVAC and lighting, which comprise 69-84% of their energy use. These stores use approximately 14.3 kWh per square foot annually – about one-quarter of convenience store intensity but still representing meaningful savings. Restaurant operations combine refrigeration, cooking equipment, HVAC, and extended hours into complex energy profiles where store energy monitoring identifies when equipment runs during prep hours when it could be off and when refrigeration and HVAC conflict.
Implementing Store Energy Monitoring
Modern store energy monitoring deploys quickly without disrupting operations or requiring significant capital investment. Wireless sensors install on electrical panels, individual circuits, and equipment to capture consumption data. No rewiring required. No operational downtime. Most installations complete in a single day, with sensors transmitting data immediately to cloud-based dashboards that provide real-time visibility from any device.
Configurable alerts notify you when consumption exceeds thresholds, when patterns indicate equipment problems, or when conditions suggest immediate attention. Store energy monitoring integrates with air quality monitoring, water leak detection, and temperature monitoring to provide comprehensive facility oversight. For stores with existing BMS systems, monitoring adds the granular data layer that most building automation lacks. For stores without BMS, monitoring provides commercial facility monitoring capabilities at a fraction of traditional system costs.
Implementation Checklist for Retail Locations
- Main panel monitoring: Establishes total facility consumption baseline
- Circuit-level monitoring: Breaks down refrigeration, HVAC, and lighting consumption
- Temperature sensors: Correlates cooler and freezer performance with energy draw
- Alert configuration: Sets thresholds for anomaly detection and equipment degradation
- Baseline establishment: Requires 2-4 weeks of data collection for accurate benchmarks
- Optimization identification: Analysis and actionable recommendations within 30 days
The MaaS Advantage for Store Energy Monitoring
Monitoring as a Service eliminates the traditional barriers to store energy monitoring adoption. Instead of capital equipment purchases and ongoing maintenance responsibility, MaaS provides comprehensive monitoring as a predictable monthly expense. Traditional energy monitoring systems require $15,000 to $50,000 or more in upfront investment. MaaS includes all hardware, software, installation, and ongoing management in a monthly subscription, converting capital expense to operating expense.
MaaS systems deploy in days, not months. Most stores achieve full monitoring capability within 10 days of agreement, compared to three months or more for traditional system procurement. And the right MaaS provider guarantees outcomes – when your monitoring partner commits to measurable energy reduction and backs that commitment with performance guarantees, incentives align. The energy waste reduction approach works because the provider succeeds when you succeed, creating partnership rather than a vendor relationship. For retail operators losing $15,000+ per store in energy waste annually, MaaS store energy monitoring delivers the visibility to capture those savings immediately.
How Much Is Your Building Wasting on Energy?
According to the EPA, most commercial buildings waste 25% on energy. The ones that monitor it don’t. See what you could save in 30 seconds.

The Bottom Line on Store Energy Monitoring
Store energy monitoring transforms one of your largest operating expenses from a fixed cost you accept to a variable you control. The data from EIA and state-level studies is consistent: 19% average savings potential across convenience stores, $6,000+ annual savings identified per location, and payback periods measured in months rather than years.
The 152,000+ convenience stores and millions of retail locations across America face the same challenge: energy costs that consume margin while providing no competitive advantage. The stores that implement store energy monitoring gain visibility their competitors lack. They catch equipment problems before failures occur. They optimize operations based on data rather than guesswork. And they convert energy waste into profit that funds growth. In an industry where $1 saved equals $18 in equivalent sales per EPA ENERGY STAR, the ROI case for store energy monitoring is compelling.
Your refrigeration is running right now. Your HVAC is cycling. Your lights are burning electricity whether anyone’s shopping or not. The question isn’t whether you’re wasting energy. It’s how much you’re wasting and what you’re going to do about it. Store energy monitoring through MaaS provides the visibility to answer the first question and the tools to act on the second. The only cost you can’t recover is the savings you miss while waiting to get started.
Frequently Asked Questions About Store Energy Monitoring
How much can store energy monitoring save?
Studies show average savings potential of 19% for convenience stores, translating to approximately $5,000 to $7,400 annually depending on store size and current efficiency levels. Savings come from identifying refrigeration inefficiencies, HVAC optimization opportunities, lighting waste, and equipment maintenance needs. Stores with older equipment or 24-hour operations typically see higher store energy monitoring savings potential. According to EPA ENERGY STAR, every $1 saved on energy equals $18 in equivalent sales for food retailers operating on thin margins. The payback period for MaaS monitoring typically ranges from 2-6 months.
What does store energy monitoring cost?
Traditional energy monitoring systems require $15,000 to $50,000+ in capital investment for hardware, software, and installation. Monitoring as a Service (MaaS) eliminates upfront costs, providing comprehensive store energy monitoring for a predictable monthly fee starting at $750. This converts capital expense to operating expense, making monitoring accessible to stores of any size. Most stores achieve positive ROI within the first few months as identified savings exceed monitoring costs. Guaranteed energy savings programs ensure you see measurable results or the provider works for free until they deliver.
How long does store energy monitoring installation take?
Modern wireless monitoring systems install in a single day for most store locations, with no operational disruption required. Sensors attach to electrical panels and equipment without rewiring. Data transmission begins immediately, with full dashboard access typically available within 24-48 hours. Most MaaS providers complete deployment from agreement to operational store energy monitoring in 10 days or less, compared to 2-3 months for traditional system procurement. The energy management system approach prioritizes speed to insight so you start seeing actionable data within weeks, not quarters.
What equipment does store energy monitoring track?
Comprehensive store energy monitoring tracks all major consumption categories: refrigeration systems including walk-in coolers, reach-in units, and display cases; HVAC systems covering heating, cooling, and ventilation; lighting including interior, exterior, and refrigerated case lighting; and miscellaneous loads including cooking equipment, POS systems, and plug loads. System-level monitoring shows which categories drive costs, while circuit-level monitoring enables identification of specific inefficient units. Integration with temperature monitoring adds equipment health correlation for predictive maintenance.
Why do convenience stores use so much electricity?
Convenience stores use approximately 52.5 kWh per square foot annually, over four times the average for commercial buildings according to EIA CBECS data. This intensity results from refrigeration systems running 24/7, extended or round-the-clock operating hours, high lighting levels required for safety and customer experience, and cooking and food prep equipment. Refrigeration alone accounts for 47-66% of total electricity consumption. Unlike office buildings that power down overnight, convenience stores maintain full operations continuously. Store energy monitoring reveals exactly which of these systems contributes most to your specific consumption profile.
How does store energy monitoring prevent equipment failures?
Continuous store energy monitoring establishes baseline consumption patterns for each piece of equipment. When a compressor starts drawing more power than normal, the system detects the deviation and alerts staff to investigate. This early warning enables maintenance intervention before complete failure occurs. Since equipment often consumes more energy as it degrades, monitoring both reduces energy waste and prevents spoilage losses that accompany refrigeration failures. Average spoilage costs run $8,600 to $10,188 per store annually according to NACS data, much of which proper monitoring and temperature monitoring systems can prevent.
Can store energy monitoring work for multi-location operators?
Yes, cloud-based store energy monitoring platforms are specifically designed for multi-location visibility. Operators can view all stores from a single dashboard, compare performance across locations, identify best practices at efficient stores, and flag underperforming locations. Benchmarking across similar stores reveals why one location uses 23% more energy than another, enabling targeted optimization. Chain operators typically see the highest ROI because insights from one store apply across all locations. Retail energy management systems scale from single locations to enterprise portfolios with the same platform.
What’s the difference between store energy monitoring and a building management system?
Traditional building management systems (BMS) cost $50,000 to $200,000+ and focus on controlling HVAC and lighting through automation. Store energy monitoring focuses on visibility and optimization, showing where energy is consumed and identifying waste. Monitoring is less expensive, deploys faster, and works for stores that can’t justify full BMS investment. For stores with existing BMS, monitoring adds the granular consumption data that most building automation lacks. MaaS monitoring provides building-management insights at a fraction of traditional BMS cost, with guaranteed results and no capital investment required.
Stop the Hidden Energy Waste in Your Store
Your refrigeration, HVAC, and lighting are running right now. The only question is how much money they’re wasting while you wait to find out. Store energy monitoring reveals the savings hiding in your operation.
- + Identify 19% average savings potential per store
- + Catch equipment problems before costly failures occur
- + Deploy in 10 days with zero capital investment
- + Benchmark performance across all locations
- + Convert energy waste into bottom-line profit
Our Guarantee
Spending over $10K/month without BMS? We guarantee a 10% reduction in energy consumption in 12 months, or we work for free until we deliver it.
From $750/month – Learn more
Email us at detect@envigilance.com | We reply within 24 hours