Airport Terminal Air Quality: The Facility Manager’s Guide to Continuous Monitoring
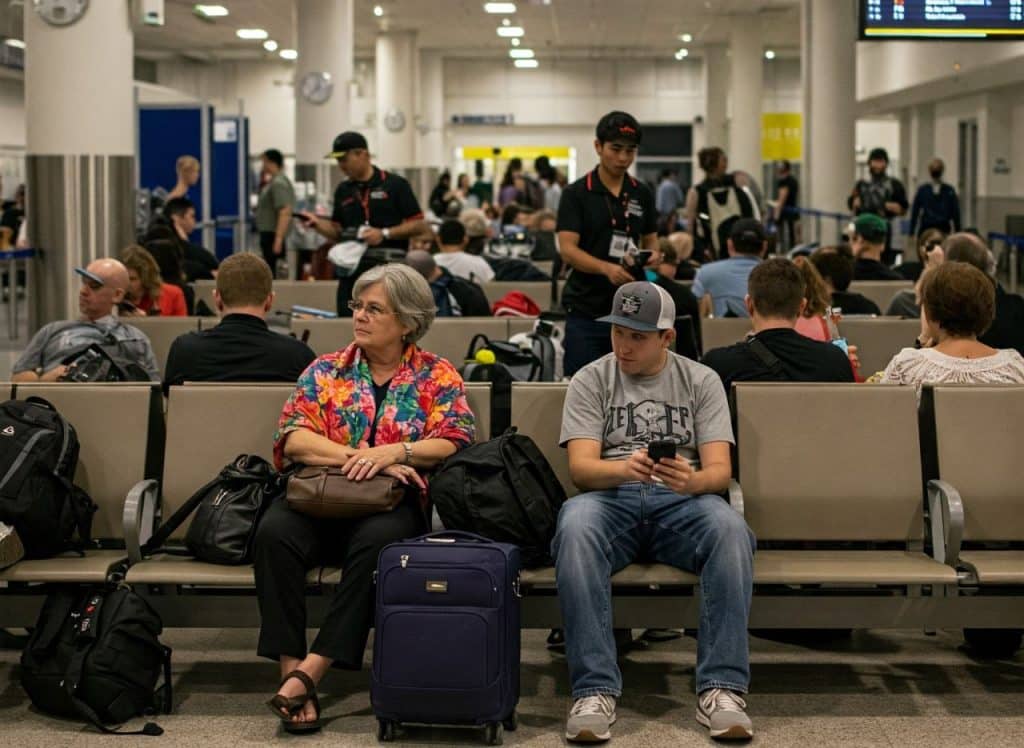
More than 2.9 million airline passengers pass through U.S. airports every single day, according to the Federal Aviation Administration. That is a continuous, around-the-clock stream of people crowding security checkpoints, gate areas, and food courts inside buildings that never close. Airport terminal air quality sits at the intersection of every IAQ challenge a facility manager can face: dense occupancy, jet exhaust infiltrating through jetways, commercial food service releasing VOCs, and HVAC systems that must perform without interruption regardless of how packed the terminal gets.
When your terminal’s air quality degrades, the consequences are not abstract. Staff working eight-hour shifts are exposed to elevated particulate matter and CO2 day after day. Passengers experience fatigue and headaches that reflect poorly on your facility. And your HVAC team is often the last to know because standard scheduled inspections do not catch the peak contamination spikes that happen during flight rushes, lunch service, or early-morning check-in surges.
This guide covers what drives poor indoor air quality in airport terminals, which regulatory standards apply, how aircraft operations affect what happens inside your building, and how continuous monitoring transforms your ability to protect passengers, staff, and your facility’s reputation. If you manage airport energy or broader airport environmental monitoring programs, air quality is the piece that ties it all together.
Airport terminal air quality affects millions of passengers and thousands of workers every day
Why Airport Terminal Air Quality Demands Continuous Monitoring
No other commercial building type concentrates so many air quality risks in a single space. Hartsfield-Jackson Atlanta processed more than 52.5 million enplanements in 2024. Dallas-Fort Worth handled 42.4 million. Denver International served 40 million, according to FAA CY2024 enplanement data. These are not offices or retail stores. They are high-density public environments that operate 24 hours a day, 365 days a year, with occupancy that swings dramatically based on flight schedules.
The airport terminal air quality challenge is structural. Airports cannot rely on opening windows the way other buildings might during a ventilation problem. Security requirements keep terminals sealed. The same passengers who bring their luggage, food, and personal care products through your doors also bring viruses, allergens, and bacteria. Add dozens of food service operations, thousands of diesel and electric ground vehicles operating nearby, and aircraft engines running within meters of your jetway walls, and you have a pollutant mix that no other building type has to manage.
Standard periodic air quality inspections are built for stable, low-occupancy environments. They capture a snapshot. But airport terminal air quality is dynamic. CO2 spikes when a 200-seat aircraft boards. VOC levels climb when the food court hits peak lunch service. PM2.5 rises during morning cleaning operations. Without continuous indoor air quality monitoring, your facility team is managing blindly. You know what the air looked like when the inspector visited last quarter. You have no idea what it looks like right now.
The scale of the passenger throughput also means that health outcomes aggregate quickly. A terminal serving 50,000 passengers a day where CO2 routinely spikes above comfort thresholds during peak boarding hours is not a minor inconvenience. It is a significant exposure event for thousands of people each morning. For your permanent staff, it is a daily occupational exposure that adds up over months and years. Managing airport terminal air quality proactively is not just a facility operations decision, it is a workforce health decision.
Why Airports Cannot Rely on Manual or Scheduled IAQ Checks
- Occupancy varies by hundreds of percent within the same hour depending on flight arrivals and departures, making any single-point measurement of airport terminal air quality unrepresentative
- Airport terminal air quality events like gaseous contaminant spikes (VOCs, CO2, NO2) occur and clear within minutes, scheduled inspections miss them entirely
- Terminals operate at night when inspectors are not present, but cleaning chemicals, aircraft idling, and HVAC setback modes create their own exposure risks
- Different zones (gates, security, food courts, baggage claim) have distinct air quality profiles that require separate monitoring points, not a single building-wide reading
The Pollutant Mix Inside Airport Terminals
Airport terminal air quality is shaped by a pollutant mix found nowhere else in commercial real estate. You are dealing simultaneously with sources that are indoor and outdoor, stationary and mobile, predictable and sudden. Understanding what you are actually measuring, and why each pollutant matters, is the foundation of any effective monitoring program.
Carbon dioxide (CO2) is the most commonly monitored airport terminal air quality parameter. It builds up whenever you pack people into enclosed spaces. Waiting areas and boarding gates are the primary drivers. CO2 does not measure air quality directly, but it serves as a reliable proxy for ventilation adequacy and occupancy load. When CO2 climbs, it signals that fresh air exchange is falling behind the pace of human occupancy, and everything else in the air is accumulating at the same rate. Poor ventilation requirements compliance is one of the leading causes of elevated CO2 in terminals.
Volatile organic compounds (VOCs) enter terminal air from multiple directions. Food courts and coffee bars produce VOCs from cooking oils and combustion. Cleaning products used overnight release formaldehyde and other compounds. Jet fuel vapors infiltrate through jetways and service corridors. Personal care products from thousands of passengers contribute measurably to VOC load. High VOC concentrations cause eye and respiratory irritation and, with chronic exposure, can contribute to more serious health outcomes. This is one reason strong airport terminal air quality monitoring programs track TVOCs continuously rather than relying on quarterly swabs.
Particulate matter (PM2.5 and PM10) is one of the most important airport terminal air quality parameters to track continuously. It comes from clothing and luggage traffic, HVAC re-entrainment, outdoor vehicle emissions pulled into terminals through doors and ventilation intakes, and jet engine exhaust. PM2.5 particles, those smaller than 2.5 micrometers, penetrate deep into the lungs and enter the bloodstream. The EPA sets a 24-hour PM2.5 threshold limit value of 25 micrograms per cubic meter, but airport terminals near active runways and vehicle staging areas can see elevated concentrations that require active filtration to manage. Sick building syndrome complaints in terminals often trace back to persistent PM2.5 exposure rather than dramatic single-pollutant events.
Nitrogen dioxide (NO2) and carbon monoxide (CO) come primarily from vehicle exhaust near terminal doors and in attached parking structures. Both can recirculate into terminal air through pressure differentials, especially when doors open frequently during peak arrivals. Parking garages connected to terminals are a particularly common pathway for CO infiltration, a risk that is easy to overlook when monitoring focuses only on the public-facing terminal floor.
Key Pollutants to Track in Airport Terminals
- CO2: Ventilation adequacy proxy; rises with occupancy load at gates and security checkpoints
- TVOCs: Food courts, cleaning agents, jet fuel vapors, personal care products from passengers
- PM2.5 / PM10: Luggage/clothing traffic, HVAC re-entrainment, outdoor vehicle and aircraft exhaust
- NO2 / CO: Ground vehicle exhaust recirculating from curbside, parking garages, and vehicle staging areas
- Formaldehyde: Cleaning products used during overnight operations; off-gassing from new construction materials in recently renovated terminals
- Humidity: High humidity amplifies airport terminal air quality problems by elevating VOC and microbial exposure; low humidity increases respiratory irritation during winter operations
Managing airport terminal air quality effectively starts with understanding these zone-level differences. According to research on terminal zones published by Prana Air, waiting areas face elevated CO2 from dense occupancy plus elevated PM2.5 from clothes, luggage, and HVAC systems. Food courts release VOCs, NO2, CO, and particulate matter from cooking vapors. Washrooms harbor microbial pollutants and TVOCs from cleaning agents. Each zone needs its own monitoring point because the pollutant profile varies significantly across the same terminal floor.
ASHRAE 62.1 and OSHA: Standards Airport Operators Must Know
ASHRAE and OSHA air quality standards form the regulatory backbone for airport terminal air quality management in commercial buildings, but there are important nuances that airport facility managers frequently get wrong.
ASHRAE Standard 62.1-2022, Ventilation for Acceptable Indoor Air Quality, is the governing standard for ventilation system design in commercial buildings including airport terminals. It establishes minimum outdoor air ventilation rates based on space type and occupancy, using two compliance paths. The Ventilation Rate Procedure (VRP) sets prescriptive outdoor air intake rates by space category. The Indoor Air Quality Procedure (IAQP) is a performance-based alternative where the ventilation system is designed to achieve target levels of indoor contaminants, a path that benefits facilities with continuous IAQ monitoring data. Under ASHRAE 62.1-2022, PM2.5 outdoor air treatment is required when ambient PM2.5 levels exceed the national ambient air quality standard, a condition that airports in urban non-attainment areas frequently face.
One clarification that matters for your airport terminal air quality documentation: ASHRAE 62.1 has not contained an indoor CO2 concentration limit for approximately 30 years. The widely cited 1,000 ppm CO2 “standard” is not in the current ASHRAE standard and has not been for decades, according to a peer-reviewed clarification published in ASHRAE Journal. CO2 is valuable as a ventilation proxy and occupancy indicator, but claiming CO2 compliance as proof of IAQ compliance does not hold up under scrutiny. Your documentation and any audit defense should be built on actual pollutant data, not a single-metric CO2 threshold.
OSHA 29 CFR 1910.1000 sets permissible exposure limits (PELs) for air contaminants and applies directly to your airport’s ground support workers, maintenance crews, custodial staff, and terminal employees. These are employees who spend full shifts in your facility, not transient passengers. OSHA 1910.1000 requires that 8-hour time-weighted average exposures for listed contaminants not exceed the specified limits. For airport terminal operations, the most relevant contaminants under this standard are carbon monoxide, nitrogen dioxide, and VOCs including formaldehyde. Willful OSHA violations can carry penalties up to $165,514 per violation. OSHA compliance monitoring requires documented, verifiable exposure data, not manual walk-through notes.
Beyond mandatory airport terminal air quality standards, many airports are voluntarily pursuing WELL Air certification, LEED v5 IAQ credits, and RESET Air compliance as differentiators in passenger satisfaction rankings and sustainability reporting. Skytrax’s 5-star terminal rating, earned by LaGuardia’s Terminal B in consecutive years, includes environmental quality criteria. These voluntary frameworks all require continuous sensor data, the same data that satisfies your ASHRAE and OSHA obligations. A well-designed airport terminal air quality monitoring program does the regulatory work and the brand work simultaneously. For airports pursuing broader airport sustainability monitoring goals, IAQ data integrates directly into your ESG and environmental reporting.
Regulatory Quick Reference for Airport Terminal IAQ
- ASHRAE 62.1-2022: Minimum ventilation rates by space type; PM2.5 outdoor air treatment required in non-attainment areas; two compliance paths (VRP and IAQP)
- OSHA 29 CFR 1910.1000: 8-hour TWA permissible exposure limits for ground support, maintenance, and terminal workers; documented monitoring required
- Note on CO2: ASHRAE 62.1 does not contain an indoor CO2 concentration limit; CO2 is a ventilation proxy, not a standalone compliance metric
- Voluntary frameworks: WELL Air, LEED v5 IAQ credits, RESET Air, all require continuous sensor data
- FAA VALE Program: Eligible airports can access federal AIP/PFC funding (75-90% reimbursement) for air quality improvement capital projects, covered in Section 7
How Aircraft Operations Affect Airport Terminal Air Quality
The most distinctive airport terminal air quality challenge, the one that separates airports from every other commercial building type, is aircraft emissions. Aircraft are not just outside your building. During taxi, boarding, and gate operations, jet engines run within meters of your terminal walls. The question is not whether those emissions affect your airport terminal air quality. The question is how much, and whether your monitoring program detects the incursion before it becomes a health event.
Jet engine exhaust during ground-level operations produces NOx, CO, unburned hydrocarbons, CO2, and particulate matter including ultrafine particles (UFPs). UFPs are defined as particles smaller than 100 nanometers, far smaller than PM2.5, which cuts off at 2.5 micrometers. Because of their size, UFPs bypass the lung’s natural filtration mechanisms entirely, crossing into the bloodstream and reaching organs including the heart and brain. A 2023 study published in npj Climate and Atmospheric Science found that UFP concentrations within the Heathrow Airport boundary exceeded World Health Organization guidance, indicating that populations outside the airport boundary could also face concern-level exposures.
A systematic review of 70 peer-reviewed studies published in Transportation Research Interdisciplinary Perspectives (2021) found consistent evidence that commercial aircraft activity elevates UFP, PM2.5, black carbon, and polycyclic aromatic hydrocarbons near airports. Adverse health effects documented in that literature include increased rates of premature death, decreased lung function, oxidative DNA damage, and pre-term births in communities near airports. For your terminal workers, those findings are not abstract community health statistics. They reflect the air your staff breathes at the workstation closest to the gate.
The pathway from aircraft operations to terminal air quality runs through several routes. Some airports maintain positive pressure in jetways, which prevents aircraft cabin air and ramp-level exhaust from flowing back into the terminal. Other facilities allow bidirectional airflow, creating an open channel between the ramp environment and your passenger concourse. Terminal doors opening during high-traffic boarding periods create additional pressure differentials that draw outdoor air, and whatever is in it, directly into the terminal. Parking structures connected to terminals have their own CO and NOx profiles that recirculate into concourse air when HVAC systems are in recirculation mode.
Managing these airport terminal air quality pathways requires more than a good HVAC design specification. It requires real-time data that tells you when an aircraft taxi event is affecting your gate area CO readings, when a high-traffic boarding sequence is pushing PM2.5 above your target threshold, and when your parking structure ventilation is failing to keep CO from migrating into the terminal. That is data only continuous airport terminal air quality monitoring provides. A well-designed equipment failure prevention program integrates IAQ thresholds with HVAC response protocols so the building responds automatically when aircraft operations affect your indoor environment.
Aircraft-Related Pathways Into Your Terminal
- Jetway pressure: Bidirectional jetway airflow is a primary pathway for airport terminal air quality degradation, allowing ramp-level exhaust and cabin air to enter the concourse
- Door infiltration: Passenger boarding creates repeated pressure differentials that draw outdoor air and associated pollutants into gate areas
- HVAC intake location: Outdoor air intakes positioned near vehicle staging areas, fuel storage, or ground support equipment zones pull contaminated air directly into your ventilation stream
- Parking structure recirculation: Connected garages are a major CO and NOx pathway when HVAC recirculation modes operate during low-demand periods
- Taxi and APU emissions: Auxiliary power unit (APU) exhaust from parked aircraft and engines during taxi can create localized pollution peaks near gates even without active aircraft engine runs

Continuous airport terminal air quality monitoring at gate level provides real-time CO2, PM2.5, and VOC data, enabling automated HVAC response during peak boarding periods.
Zone-by-Zone Risk: Where Airport Terminal Air Quality Monitoring Matters Most
Not every part of your terminal carries the same airport terminal air quality risk. Treating the entire building as a single zone, one HVAC system, one thermostat, one spot-check location, guarantees that your highest-risk airport terminal air quality zones go unmonitored. A one-month real-time monitoring study conducted at Bologna Airport, published in the peer-reviewed journal Sensors (MDPI) and indexed in PubMed Central, found that daily IAQ variation followed passenger flow patterns for gaseous contaminants but that HVAC systems, while efficient at particulate filtration, were insufficient at removing gaseous contaminants from passenger and food service activity. The boarding gate area consistently showed temperature and humidity conditions outside comfort range, while the security check area, better served by mechanical systems, stayed within targets. That is a zone-level finding. It does not appear in building-wide averages.
Security checkpoints are among the most demanding airport terminal air quality zones in any facility. Thousands of passengers queue in relatively small footprints during peak hours, generating CO2 through exhalation and PM2.5 from luggage and clothing agitation. The architectural constraints of security layouts often limit HVAC capacity in these areas relative to the occupancy density they experience.
Gate waiting areas cycle between near-empty and fully packed depending on the departure schedule. A single 737 gate can go from 20 people to 180 within 30 minutes. That occupancy surge produces a CO2 spike that peaks just as passengers board and then clears, a pattern that only continuous monitoring captures. Gates near jet bridges have the additional aircraft emissions infiltration risk described in the previous section.
Food courts and concessions represent a distinct airport terminal air quality challenge driven by VOC and PM sources. Cooking oils, commercial cleaning degreasers, and high-heat food preparation all produce volatile organic compounds that accumulate in the surrounding air. These areas also generate CO and NO2 if any gas-fired cooking equipment is in use. VOC levels in airport food courts have been measured at elevated concentrations compared to non-food-service terminal zones, based on the Aeropulse terminal zone analysis referenced in the research for this article.
Baggage claim areas experience significant airport terminal air quality variation because they are typically located close to vehicle pick-up and drop-off curbside zones. Diesel taxis, ride-share vehicles, shuttle buses, and fuel-powered vehicles idling at the curb produce CO and NOx that infiltrate through automatic doors. When your baggage claim area is running CO above comfortable thresholds, the source is almost always the curbside vehicle environment, not a mechanical failure inside the building.
Attached parking structures are among the least monitored and highest-risk IAQ zones for terminal workers. CO builds up in enclosed garages and follows pressure gradients toward adjacent climate-controlled spaces. Terminal employees working near the parking-to-terminal connection points, ticketing agents, baggage handlers, security staff near lower-level exits, may experience the highest ambient CO exposures in the entire facility. This is one of the clearest OSHA compliance risks in airport terminal air quality management and one of the most overlooked. Consider how mechanical room monitoring principles, continuous sensing in a high-risk zone that is rarely occupied by management, apply directly to your parking level exposures.
Recommended Monitoring Points by Terminal Zone
- Security checkpoints: CO2, PM2.5, temperature, humidity, occupancy-driven contamination peaks
- Gate waiting areas: CO2, TVOCs, PM2.5, aircraft emissions infiltration + occupancy load
- Food courts / concessions: TVOCs, CO2, PM2.5, CO, NO2, food service emissions
- Baggage claim: CO, NO2, PM2.5, curbside vehicle exhaust infiltration
- Parking structure connections: CO, NO2, highest OSHA compliance risk for terminal workers
- Overnight operations areas: TVOCs, formaldehyde, cleaning product off-gassing during maintenance windows
What Continuous Monitoring Catches That Periodic Inspections Miss
The case for continuous airport terminal air quality monitoring comes down to a simple fact: the events that matter most happen between scheduled inspections. A quarterly walk-through captures the air quality in your terminal on a Tuesday morning at 10 a.m. when an inspector is present. It tells you nothing about what happened at 6 a.m. during the first wave of departures, or at 11 p.m. during overnight cleaning operations, or during the Monday holiday weekend when your terminal ran at three times its normal capacity.
Protecting airport terminal air quality means acting on data before passengers and staff experience symptoms. Research from the Harvard T.H. Chan School of Public Health tracked more than 300 office workers across six countries over one year and found that elevated PM2.5 and higher CO2 concentrations were associated with slower response times and lower accuracy on cognitive tasks, at concentrations that are common in indoor environments. Participants showed impaired cognitive function without reporting obvious symptoms. The exposure threshold at which performance degraded was not a dramatic, odor-warning level. It was the kind of gradual accumulation that happens during a three-hour morning boarding rush when your HVAC system is struggling to keep pace with occupancy load.
A separate meta-analysis of airport and facility air quality and worker performance, published in peer-reviewed research catalogued in PubMed, found that poor indoor air quality decreases productivity by 6 to 9 percent. For an airport with thousands of employees, gate agents, security staff, retail workers, custodial teams, that is a measurable operational cost. The same data applies whether your workers are in offices or airport terminals. The mechanisms of PM2.5 and VOC exposure on cognitive function are not building-type specific.
Continuous monitoring also enables demand-controlled ventilation, one of the most effective tools for improving airport terminal air quality and reducing HVAC energy consumption. When your system can see real-time CO2 and occupancy signals from each terminal zone, it can ramp outdoor air intake up precisely when needed, during a boarding surge at gate 22, and scale back when that gate is empty. That precision is impossible with a timer-based or fixed-rate ventilation schedule. It is also the approach that positions your facility for ASHRAE 62.1 IAQP compliance, which rewards sensor-informed design with more operational flexibility. For a deeper look at how air quality inspections and continuous monitoring programs align, that resource covers the compliance documentation side in detail.
The same principles that drive office building air quality monitoring programs apply at scale to airports. The operational case for continuous monitoring extends to healthy building monitoring certifications that are increasingly influencing airport concession lease values and airline terminal preference decisions. Airports that can demonstrate verifiable, ongoing IAQ performance data have a competitive differentiator in attracting premium airline partners and concession operators who want to brand their presence in a documented healthy environment.
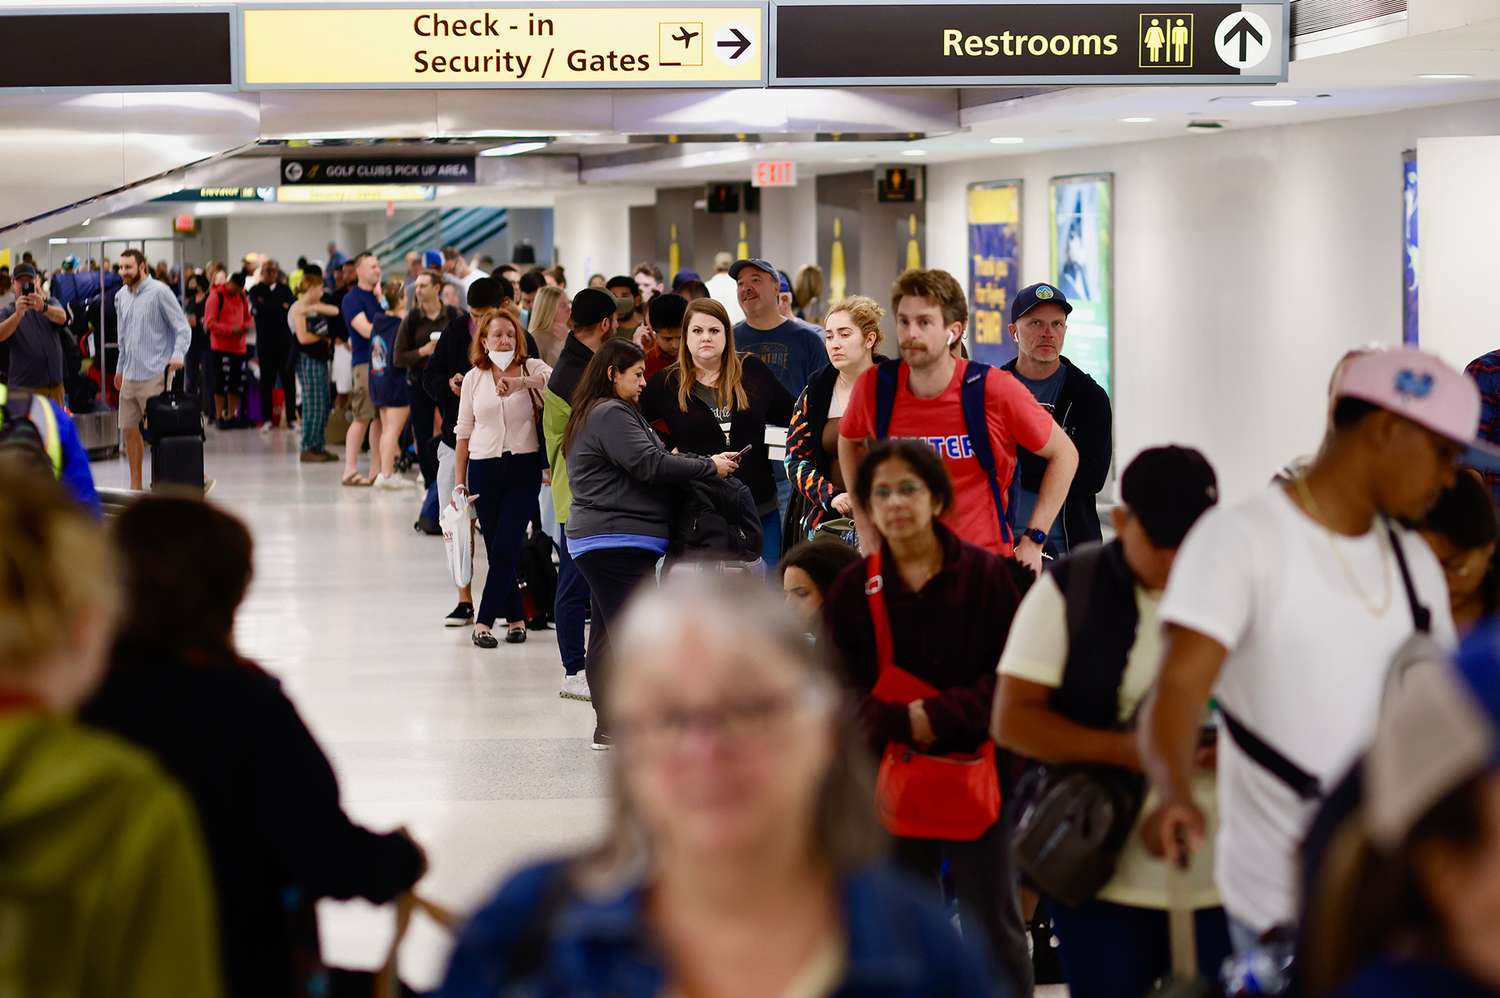
Zone-level airport terminal air quality sensors at gate areas and food courts capture the CO2 surges, VOC spikes, and PM2.5 events that building-wide averages miss, giving facilities teams the real-time data needed to respond before passengers and staff are affected.
Do You Know What Your Terminal’s Air Quality Looks Like Right Now?
Discover how continuous monitoring can protect your passengers, staff, and facility reputation. Our experts will assess your current terminal vulnerabilities and show you exactly what’s at risk.
The FAA VALE Program: How Airports Fund Air Quality Improvements
Budget constraints are the most common reason airport terminal air quality improvement programs stall before they start. Capital expenditure for sensor infrastructure, HVAC upgrades, and filtration improvements competes with terminal renovation, runway maintenance, and security technology. The FAA’s Voluntary Airport Low Emissions (VALE) Program exists specifically to address this funding barrier for eligible airports.
Created in 2004 and administered by the FAA, the VALE program allows eligible commercial service airports in National Ambient Air Quality Standards (NAAQS) non-attainment or maintenance areas to use Airport Improvement Program (AIP) funds and Passenger Facility Charges (PFCs) to finance air quality improvement capital projects. Reimbursement rates run at least 75 percent for large and medium hubs and 90 percent for small hubs. As of October 2023, VALE grants had funded 141 projects at 58 airports and were expected to reduce ozone emissions by 1,768 tons per year, the equivalent of removing 98,700 cars and trucks from the road annually.
Eligible VALE projects include gate electrification, pre-conditioned air units (which eliminate the need for diesel auxiliary power unit operation), electric charging infrastructure for ground support equipment, and other capital improvements that directly reduce airport ground emissions. Projects that improve airport terminal air quality must generate documented Airport Emission Reduction Credits (AERCs) that airports can then apply to future development projects to satisfy Clean Air Act general conformity requirements, making VALE funding doubly valuable as both an IAQ investment and a long-term regulatory currency.
According to Airports Council International North America, the recent expansion of the VALE program eliminated the requirement for a Letter of Assurance from the State Air Quality agency, which had previously added significant time and administrative burden to the application process. The FAA’s companion Zero Emissions Vehicle (ZEV) Pilot Program offers a parallel funding path specifically for purchasing zero-emission airport vehicles and supporting infrastructure.
Pre-conditioned air (PCA) systems are among the most impactful VALE-eligible investments for airport terminal air quality improvement. When parked aircraft connect to terminal-supplied power and air conditioning rather than running their auxiliary power units, the diesel and jet fuel combustion right outside your jetwall stops. That single change eliminates one of the most direct sources of VOC, NO2, and PM infiltration into your gate areas. Airports that have completed PCA retrofits consistently report improved air quality in adjacent gate areas. Connecting that improvement to your continuous airport terminal air quality monitoring data creates the documented, verifiable outcome that supports future VALE applications and ESG reporting programs.
How MaaS Monitoring Solves the Airport Terminal Air Quality Challenge
Traditional BMS deployments address airport terminal air quality as one feature among many expensive, long-lead projects that require significant upfront capital and dedicated IT infrastructure. For airports managing aging terminal infrastructure alongside major capital renovation programs, committing to a full BMS deployment just to gain IAQ visibility is often not realistic. Monitoring as a Service (MaaS) delivers the same continuous sensor coverage and real-time alerting at a predictable monthly service fee designed for airport terminal air quality management, without the capital outlay, installation complexity, or IT overhead of a full BMS build-out.
Envigilance deploys wireless MaaS monitoring for airport terminal air quality across terminal zones in days, not months. There is no rewiring, no server room, no complex integration project, the same commercial real estate building automation approach Envigilance uses across property portfolios applies directly to airport terminal environments. Sensors go up. Data streams immediately. Your facilities team sees CO2, PM2.5, TVOCs, temperature, humidity, CO, and NO2 readings in real time from every monitored zone on a single dashboard. When any airport terminal air quality parameter exceeds your configured threshold, CO2 climbing at gate 18 during a delayed boarding event, PM2.5 spiking in the food court during lunch rush, your team gets an immediate alert and can respond before passengers or staff are adversely affected.
The same platform that manages healthcare air quality monitoring also handles your terminal’s air quality also monitors temperature across food service equipment, retail refrigeration, and medication storage areas in airport medical facilities, water leak detection in mechanical rooms and restrooms, and energy monitoring across your HVAC and lighting systems. That unified view is particularly valuable for airport facilities teams managing buildings that span multiple concourses, parking structures, and support facilities across a large footprint.
As the Honeywell Building Technologies team noted in Aviation Pros, integrating IAQ sensors with HVAC systems empowers airport facility managers to automatically maintain a safer indoor atmosphere, and communicating those IAQ levels publicly builds passenger trust and a sense of security. MaaS delivers precisely that integration without requiring your team to manage complex building automation software or dedicate IT resources to sensor infrastructure.
The 2024 National Academies report, Understanding Airport Air Quality and Public Health Studies Related to Airports (Second Edition), reflects the growing body of peer-reviewed literature connecting airport operations to documented health outcomes for workers and communities. That regulatory and scientific attention to airport terminal air quality is not decreasing. Airports that build continuous airport terminal air quality monitoring into their operations now are positioned to demonstrate proactive compliance as federal and state air quality oversight intensifies, and to use that data to support VALE funding applications, WELL certification, and the airport sustainability monitoring programs that influence airline and concessionaire partnerships. For airports thinking about the full picture, our airport environmental monitoring guide covers the broader framework that IAQ feeds into.
Frequently Asked Questions
What are the biggest airport terminal air quality problems facility managers face?
The core challenges in airport terminal air quality are dynamic occupancy, aircraft emissions infiltrating through jetways and doors, and multiple simultaneous pollution sources operating in adjacent zones. Security checkpoints pack hundreds of passengers into constrained spaces, driving CO2 spikes. Gate areas cycle between empty and fully loaded within minutes. Food courts release VOCs and particulate matter from cooking activity. And parking structures connected to terminal buildings create continuous CO and NO2 infiltration risks. Standard HVAC systems handle particulate filtration adequately but often fall short on gaseous contaminant removal during peak activity, as documented in real-world terminal monitoring studies. Continuous multi-point sensor coverage across all terminal zones is the only way to manage these challenges proactively rather than reactively.
What ASHRAE standard applies to airport terminal air quality?
ASHRAE Standard 62.1-2022, Ventilation for Acceptable Indoor Air Quality, is the governing standard for airport terminal ventilation design. It sets minimum outdoor air ventilation rates based on space type and occupancy through two compliance paths: the Ventilation Rate Procedure (prescriptive) and the Indoor Air Quality Procedure (performance-based). Importantly, ASHRAE 62.1 does not contain an indoor CO2 concentration limit, that provision was removed approximately 30 years ago. CO2 is a useful ventilation proxy but is not a standalone compliance metric under current ASHRAE standards. The IAQP compliance path rewards airports that have continuous IAQ sensor data with more operational flexibility in how they design and operate ventilation systems. ASHRAE 62.1-2022 also requires PM2.5 outdoor air treatment when ambient conditions exceed national air quality standards, a condition relevant to many urban airports.
How do aircraft emissions affect airport terminal air quality?
Aircraft operations affect airport terminal air quality through several direct pathways. Jet engine exhaust during taxi and gate operations produces NOx, CO, unburned hydrocarbons, and ultrafine particles (UFPs) smaller than 100 nanometers. These particles and gases enter terminals through bidirectional jetway airflow, through doors opening during boarding, and through HVAC outdoor air intakes positioned near aircraft staging areas. Auxiliary power unit (APU) exhaust from parked aircraft is a particularly concentrated emission source near gate areas. Research published in npj Climate and Atmospheric Science found that UFP concentrations within the Heathrow Airport boundary exceeded WHO guidance, indicating elevated exposure risk for workers and passengers in close proximity to active aircraft. Continuous monitoring at gate-level positions your team to detect and respond to these incursion events in real time.
Does OSHA cover airport terminal air quality for employees?
Yes. OSHA 29 CFR 1910.1000 sets permissible exposure limits for air contaminants and applies to airport ground support workers, maintenance crews, custodial staff, and terminal employees, anyone who is not a flight deck crew member on an aircraft in operation. These employees spend full shifts in your terminal, making their cumulative daily exposures to CO, NO2, VOCs, and PM2.5 a direct OSHA compliance matter. Willful violations can carry penalties up to $165,514 per violation. Compliance requires documented, verifiable exposure data based on actual air monitoring, not periodic visual inspections or isolated spot checks. OSHA and FAA operate under a Memorandum of Understanding that clarifies OSHA’s authority over ground-based airport employee working conditions separate from FAA’s authority over flight deck crew operations.
What is the FAA VALE program and how does it fund airport terminal air quality improvements?
The FAA’s Voluntary Airport Low Emissions (VALE) program, established in 2004, allows eligible commercial service airports in NAAQS non-attainment or maintenance areas to use Airport Improvement Program (AIP) funds and Passenger Facility Charges (PFCs) to finance capital projects that improve airport air quality. Reimbursement rates are at least 75 percent for large and medium hub airports and 90 percent for small hubs. Eligible projects include gate electrification, pre-conditioned air units that replace diesel APU operation, electric ground support equipment charging infrastructure, and other proven air quality improvement capital investments. As of October 2023, VALE had funded 141 projects at 58 airports. Airports receive Airport Emission Reduction Credits (AERCs) for VALE projects, which can then be applied to future development projects to meet Clean Air Act general conformity requirements. Applications are submitted to FAA Airports District Offices annually.
Which zones in an airport terminal have the worst air quality?
Research on airport terminal air quality consistently identifies several high-risk zones. Security checkpoints concentrate the highest passenger density in the smallest footprint, generating CO2 spikes during peak screening periods. Gate waiting areas near jet bridges face both occupancy-driven CO2 buildup and aircraft emission infiltration from adjacent ramp operations. Food courts and concession areas release VOCs, CO, and PM from commercial cooking activity. Baggage claim areas near curbside vehicle pick-up zones face CO and NO2 infiltration from vehicle exhaust. Attached parking structures are the highest-risk zone for terminal employees in terms of CO exposure, with contaminated air following pressure gradients toward climate-controlled terminal spaces. A real-world monitoring study at Bologna Airport documented that boarding gate areas consistently exceeded temperature and humidity comfort ranges while security zones performed better, confirming that zone-level monitoring reveals problems that building-wide averages mask.
How does poor airport terminal air quality affect airport workers’ health and productivity?
Poor airport terminal air quality affects workers through both direct health effects and documented cognitive performance degradation. Harvard T.H. Chan School of Public Health research tracking over 300 workers in six countries found that elevated PM2.5 and CO2 concentrations caused slower response times and lower accuracy on cognitive tasks at concentrations common in indoor environments. A meta-analysis in peer-reviewed literature found that poor indoor air quality decreases worker productivity by 6 to 9 percent. For airport terminal employees, gate agents, security staff, retail workers, custodial crews, these effects accumulate over full shifts and long careers of daily exposure. Direct health risks include respiratory irritation, headaches, fatigue, and with prolonged high-VOC exposure, more serious outcomes. OSHA’s documented willful violation penalty structure, up to $165,514 per violation, reflects the seriousness with which regulators treat demonstrable occupational air quality exposures for ground-based workers.
What sensors should an airport terminal air quality monitoring system include?
A complete airport terminal air quality monitoring deployment should include sensors for CO2 (ventilation effectiveness and occupancy proxy), PM2.5 and PM10 (particulate matter from passengers, luggage, outdoor infiltration, and aircraft operations), TVOCs (food service, cleaning products, jet fuel vapors), CO (parking structure infiltration and vehicle exhaust), NO2 (vehicle and aircraft exhaust), temperature, and relative humidity. Gate areas benefit from the full parameter set due to aircraft emissions exposure risk. Security checkpoints and waiting areas prioritize CO2, PM2.5, and humidity. Food courts require TVOCs, CO, and NO2 coverage. Parking-level connections require CO monitoring given OSHA exposure limit requirements. A MaaS deployment places wireless sensors across all zones and streams data to a centralized dashboard, providing real-time alerts, historical trend data for compliance documentation, and integration with HVAC control systems for demand-controlled ventilation response.
Ready to See Your Terminal’s Air Quality in Real Time?
Stop managing airport terminal air quality with quarterly snapshots. Continuous zone-level monitoring gives your team real-time alerts, OSHA-ready documentation, and a predictable monthly service fee that replaces costly BMS infrastructure.
- + Real-time CO2, PM2.5, TVOC, CO, and NO2 alerts across every terminal zone
- + OSHA-ready documented exposure data for ground support and terminal workers
- + ASHRAE 62.1 IAQP compliance path supported by continuous sensor data
- + Baseline emissions data that strengthens FAA VALE grant applications
- + Deploys in 10 days, no capital expense, no BMS integration required
Email us at detect@envigilance.com | We reply within 24 hours